


Quotex indicators section offers 11 free indicators and 18 oscillators. These tools come with fully customizable settings, allowing traders to modify timeframes, levels, and visual styles.

List of Quotex Indicators and Oscillators
Quotex broker provides a wide range of built-in technical analysis indicators and oscillators to support both beginner and advanced traders. Here are the available options:
- Quotex indicators: Alligator, Bollinger Bands, Envelopes, Fractal, Ichimoku Cloud, Keltner Channel, Donchian Channel, Supertrend, Moving Average, Parabolic SAR, and Zig Zag;
- Quotex oscillators: ADX, Aroon, Awesome Oscillator, Bears Power, Bulls Power, CCI, DeMarker, ATR, MACD, Momentum, RSI, Rate of Change, Stochastic Oscillator, Schaff Trend Cycle, Vortex, Volume Oscillator, Williams %R, and Weis Waves Volume Oscillator.
Quotex Best Indicators
Below, we break down the 8 most effective indicators to use on the Quotex Platform for consistent binary options performance.
CCI
Commodity Channel Index measures the deviation of price from its statistical mean over a chosen period. It helps identify cyclical trends and is particularly useful in ranging markets.
When the CCI rises above +100, it signals strength; when it drops below -100, it suggests weakness. Traders often use it to spot reversals before they occur.

Average Directional Index (ADX)
ADX helps measure the intensity of a trend rather than its direction. It oscillates between 0 and 100. A reading above 25 indicates a strong trend, while values below 20 imply weak or no trend.
It is often used in combination with +DI and -DI lines to determine entry points.

Alligator
The Alligator indicator is composed of three smoothed moving averages known as the Jaw, Teeth, and Lips. These lines help detect the start and end of trends.
When the lines are intertwined, the market is asleep. When they separate and fan out, the market wakes up and a trend begins.

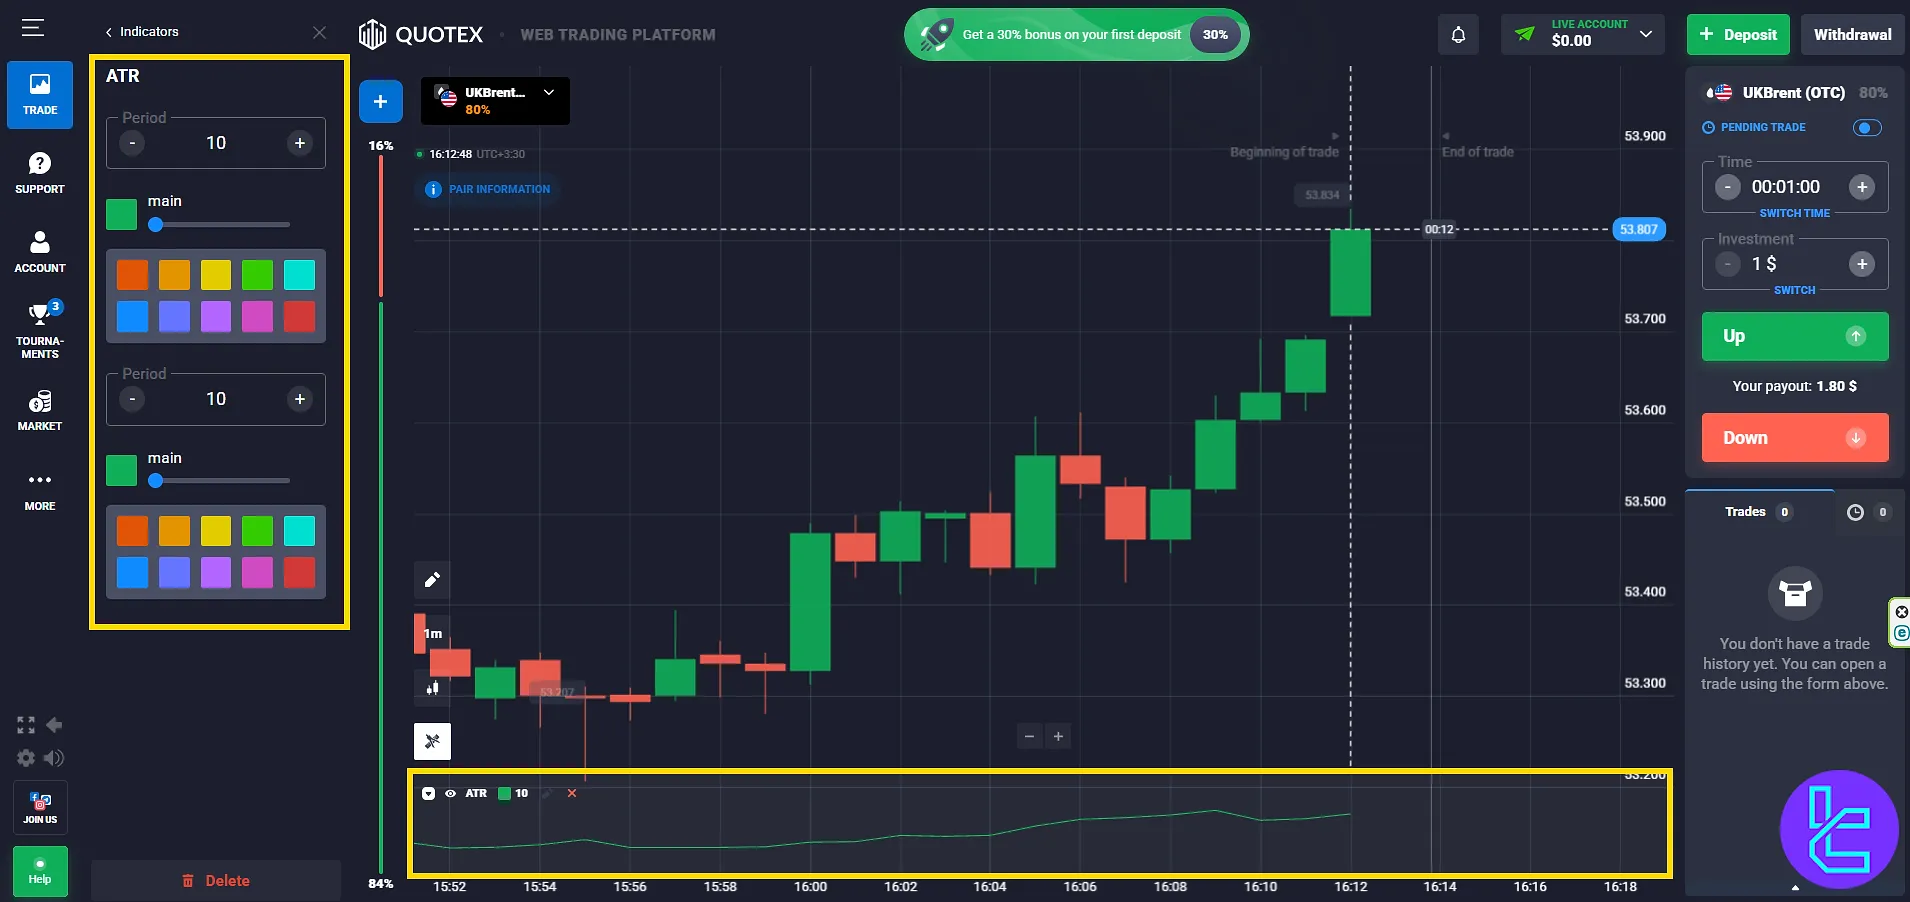
Average True Range (Indicator)
The Average True Range indicator is a volatility oscillator that calculates the average of true ranges over a specific number of periods.
It helps traders assess how much an asset typically moves, which is crucial when setting stop-loss and take-profit levels. A rising ATR shows increasing volatility and potential breakout zones.
Bollinger Bands
Bollinger Bands consist of a central moving average line and two bands plotted at standard deviations above and below it. These bands expand and contract based on volatility.
When price moves near or beyond the bands, it may indicate overbought or oversold conditions, hinting at a potential reversal or breakout.

Relative Strength Index (RSI)
RSI is a momentum oscillator that compares the magnitude of recent gains to recent losses to determine overbought or oversold conditions.
It moves between 0 and 100, with thresholds typically set at 70 (overbought) and 30 (oversold). It is widely used to anticipate corrections and reversals in price.

Moving Average Convergence Divergence (MACD)
MACD uses the difference between two EMAs to reveal trend momentum. It consists of the MACD line, signal line, and histogram.
A crossover of MACD above the signal line often implies bullish momentum. When below, it may suggest bearish strength. It is highly regarded for timing entries and exits.

Moving Average (MA)
Moving Averages are essential tools to filter out market noise and identify the general direction of a trend. The two most common types (SMA and EMA) are used to detect crossovers and support/resistance levels.
They help traders align with the prevailing market momentum and reduce reactive trading.

How to Use Indicators in Quotex
To activate any indicator, click the indicators icon on the platform, the full list of indicators and oscillators will appear. You can then choose and activate the ones you need with a single click.

Optimizing Indicator Settings on Quotex
When you select an indicator from the list, you will automatically be taken to its settings section. Each indicator allows configuration of timeframes, levels, and colors.

TF Expert Suggestion
Traders can use the best Quotex indicators such as Average True Range, Moving Average, Bollinger Bands, etc. to enhance the quality of their technical analysis and improve their win-rate. The Quotex dashboard provides access to multiple oscillators as well, including RSI, Stochastic, and CCI.
Now that you are familiar with the best available indicators, you must fund your account using the Quotex deposit and withdrawal methods listed on the Quotex tutorial page, and begin trading with this broker.